gnuplot
gnuplot is another option for building diagrams within org-mode.
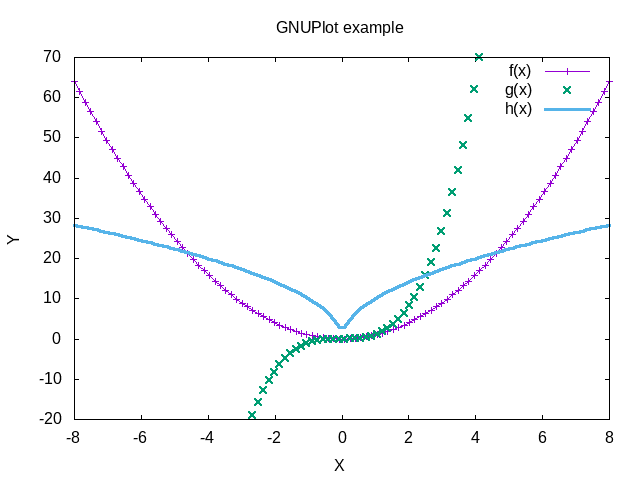
reset

set title "GNUPlot example"

set xlabel "X"
set xrange [-8:8]
set xtics -8,2,8


set ylabel "Y"
set yrange [-20:70]
set ytics -20,10,70

f(x) = x**2
g(x) = x**3
h(x) = 10*sqrt(abs(x))

plot f(x) w lp lw 1, g(x) w p lw 2, h(x) w l lw 3