R
R can be used to generate graphs in org-mode as well.
To display/export images, you need to add :results output graphics to your
source block header.
library(ggplot2)

ggplot(mpg, aes(displ, hwy, colour = class)) +
  geom_point()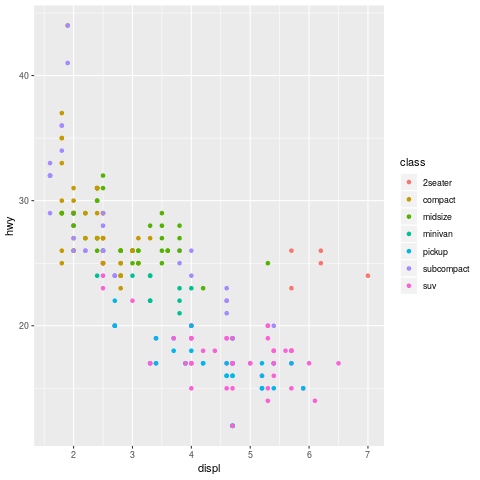
R can be used to generate graphs in org-mode as well.
To display/export images, you need to add :results output graphics to your
source block header.
library(ggplot2)
ggplot(mpg, aes(displ, hwy, colour = class)) +
geom_point()